10905 JL
Background analysis
As opposed to 9343 AM here the dark areas in the borders are much smaller. We can also see that there is more fluorescence around the cells but there are no internal holes.
Probably this image refers to a test where the ANA is positive with
high titer (i.e. the highest dilution of patient serum at which the test is still positive).
From http://library.med.utah.edu/WebPath/IMMHTML/IMM002.html
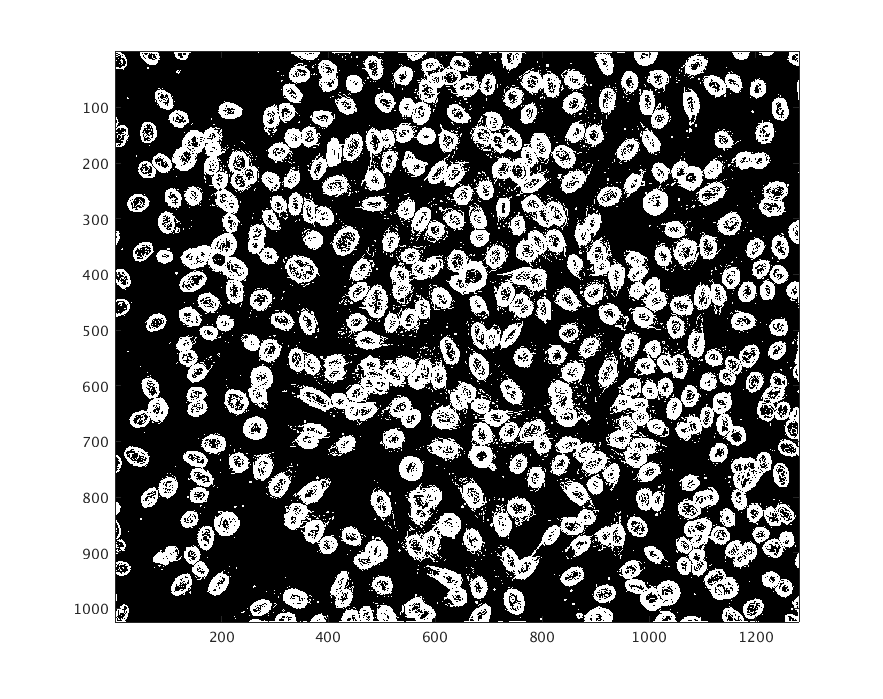
Otsu
Results (optimal threshold = 0.1333)

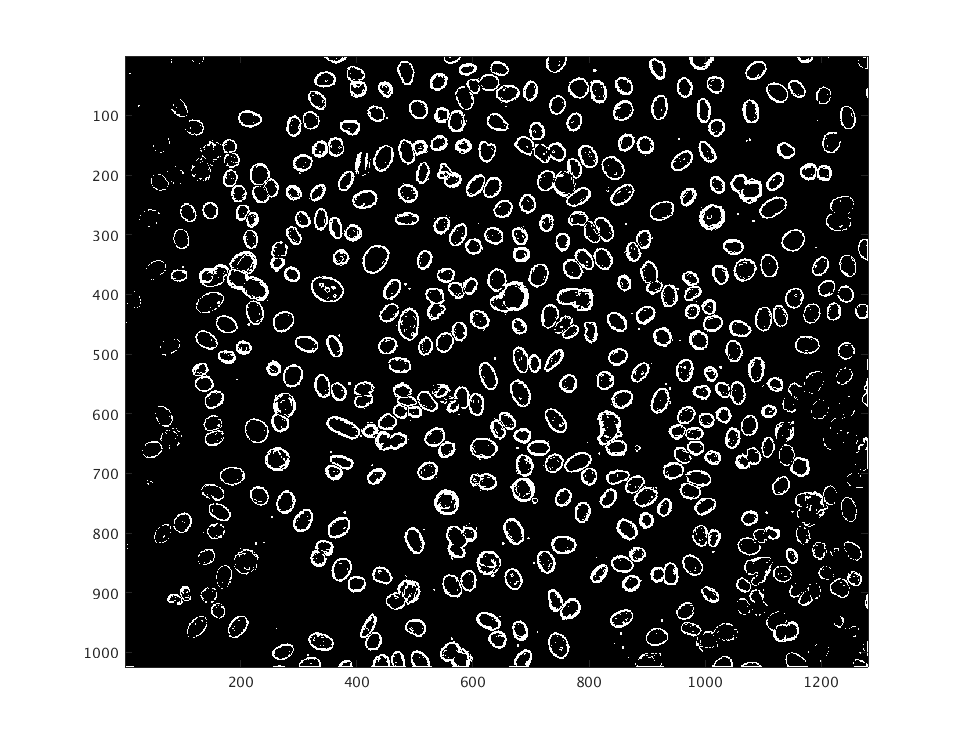
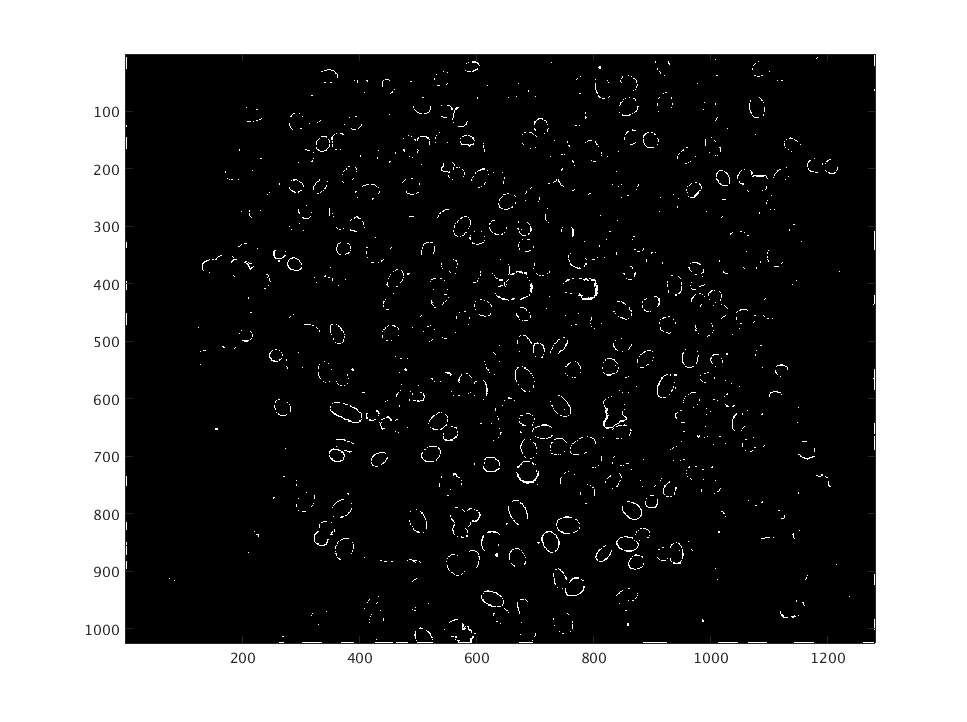
Sobel
Here Sobel did better around the borders of the image (compared to 9343 AM). This is because of the nature of the image (see background analysis).
Results (low, optimal and high threshold)
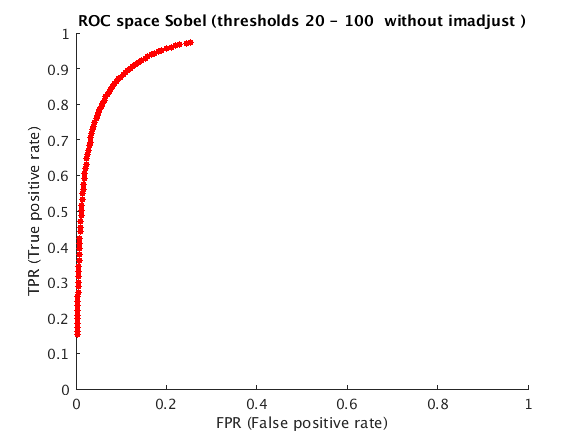
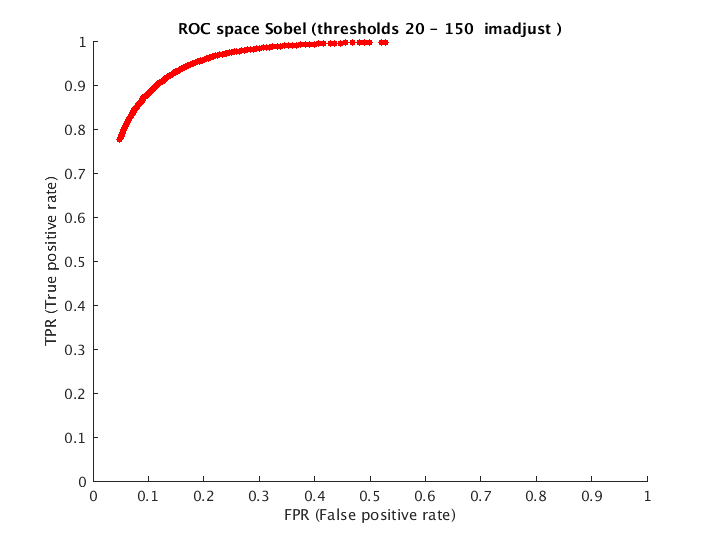
ROC space
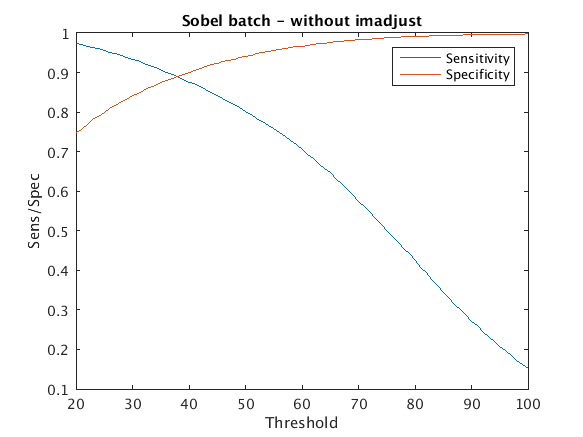
As we can see, Sobel performed better in this pattern of fluorescence rather than the one of 9343 AM. One can notice that for most threshold values the specificity was more than 0.98. This is because the cells in the current image do not have a lot of internal holes as found in 9343 AM which makes the Sobel operator detect only the external edges.
Sensitivity/Specificity against threshold
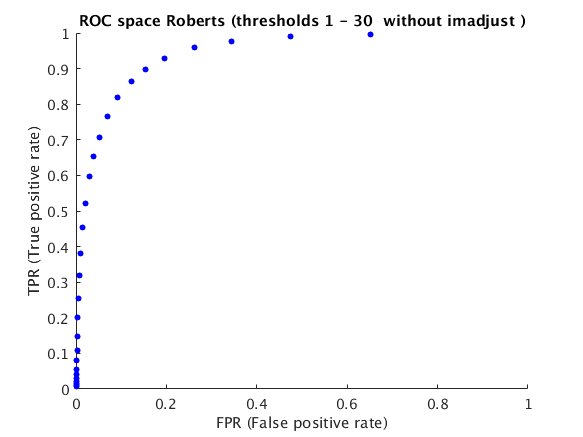
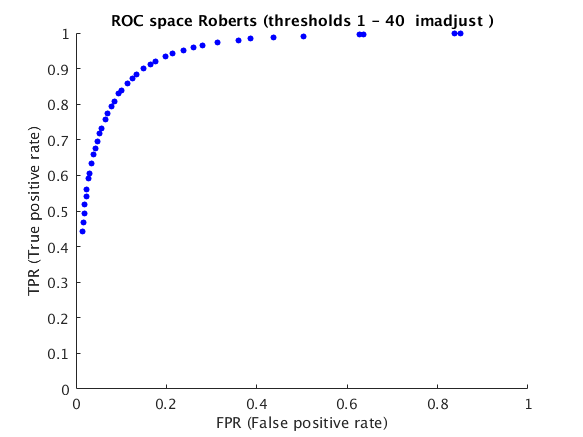
Roberts
The same reasoning used for Sobel compared to 9343 AM Sobel applies here (more specificity).
ROC space
Sensitivity/Specificity against threshold
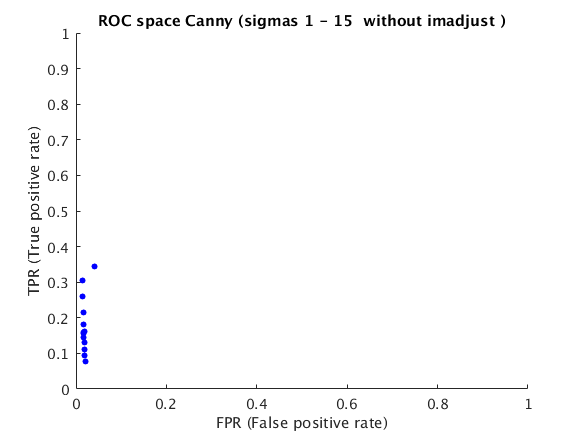
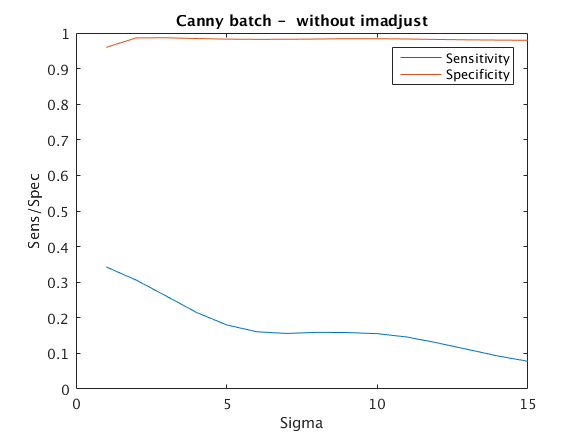
Canny
Here the behaviour of Canny is almost exactly the same as for 9343 AM.
ROC space
See report for information on why Canny performed "badly". Even between sigma (0, 1] the sensitivity is under 0.40
Sensitivity/Specificity against sigma
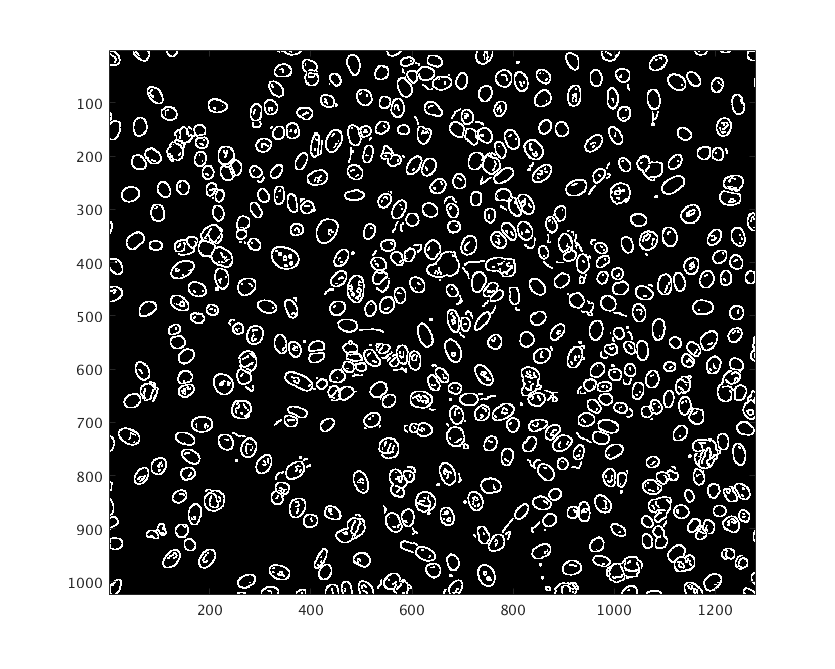
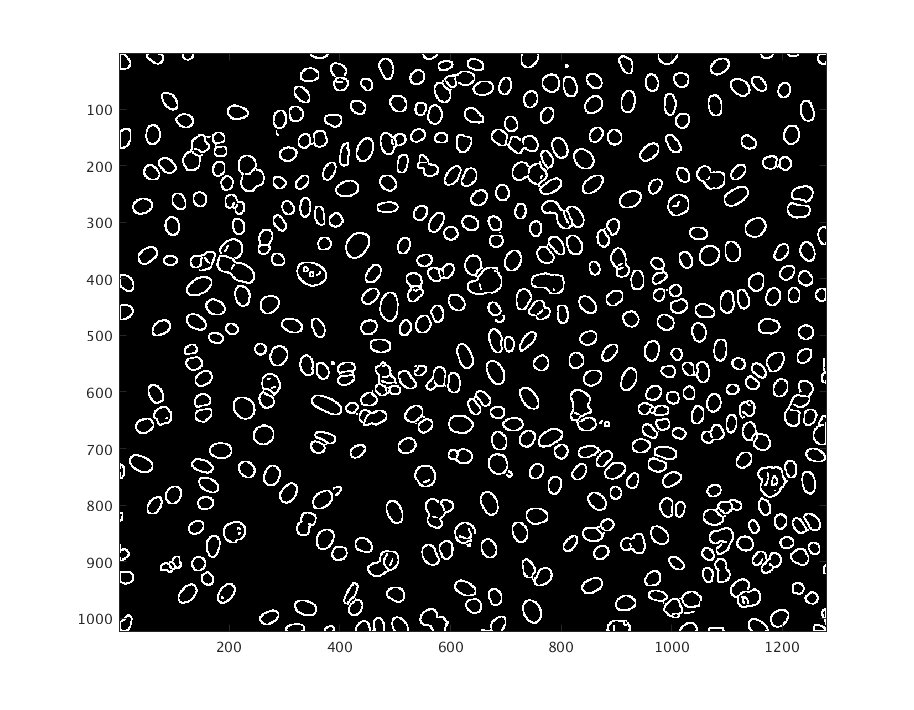
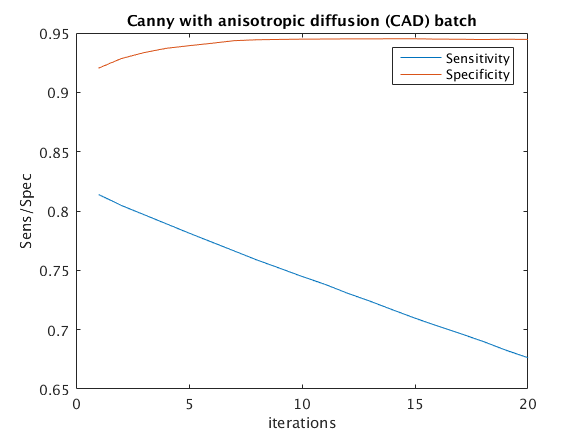
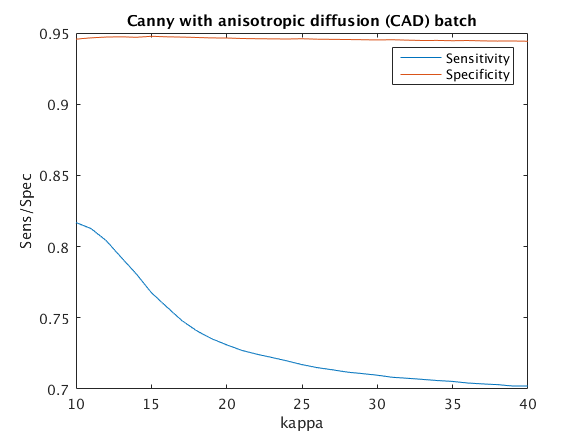
Canny with Anisotropic Diffusion
For explanations please see the attached report.
Results (1, 10 and 20 iterations)

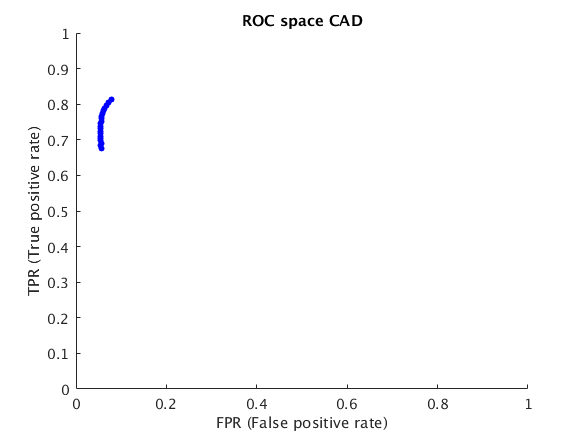
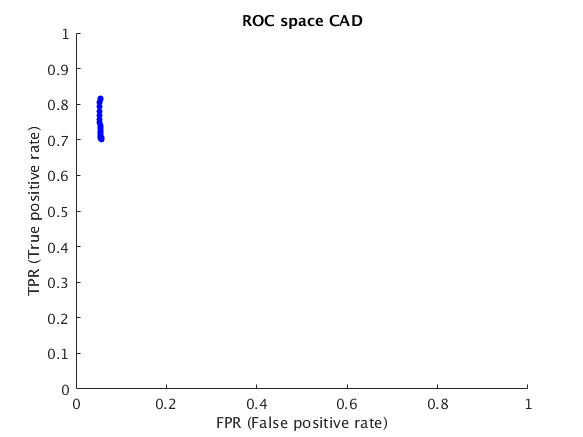
ROC space
CAD applied on 10905 JL performed better than CAD applied on 9343 AM. As we can see from the images, we already eliminated most of the intra-cell edges after 10 iterations of Anisotropic Diffusion.
Sensitivity/Specificity against number of iterations and kappa
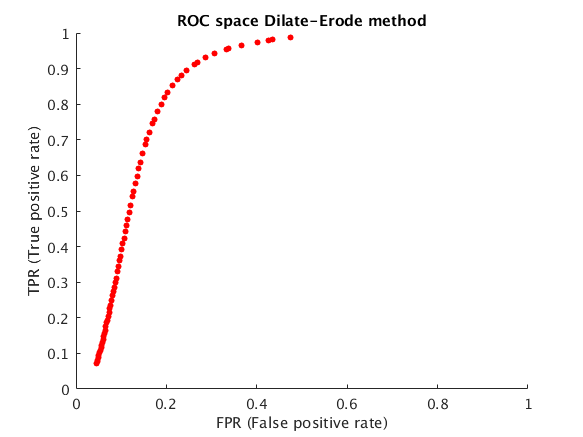
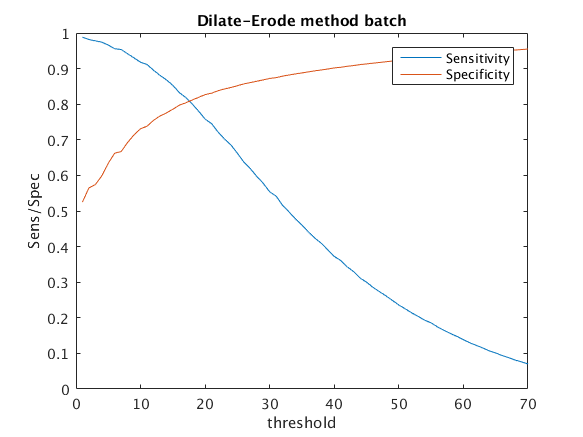
Dilate-Erode method
For explanations please see the attached report.
ROC space
Sensitivity/Specificity against threshold
Here we can notice that the sensitivity decreases very fast compared to Sobel (or Roberts). This is because during the erode process some edges might be removed and this propagates to the Sobel edge detection and thresholding.
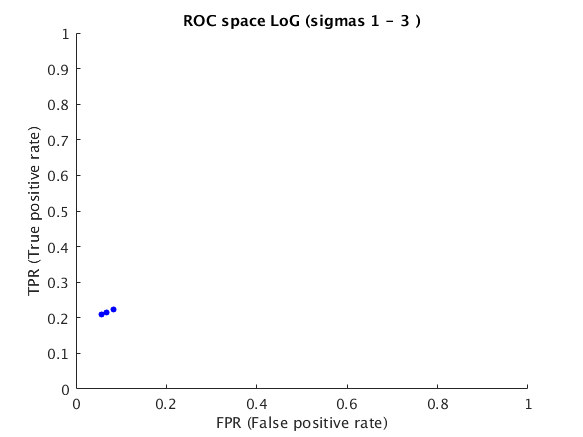
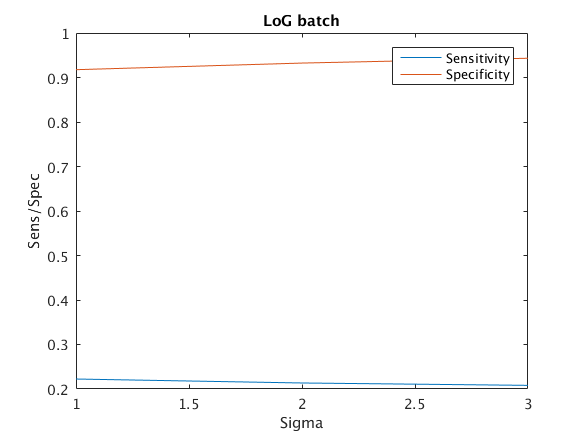
Laplacian of Gaussian
For explanations please see the attached report.
ROC space
It can be noted that LoG did not perform very well with this image.
Sensitivity/Specificity against sigma
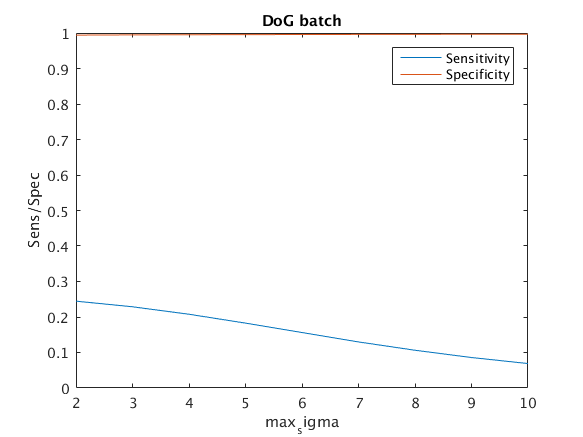
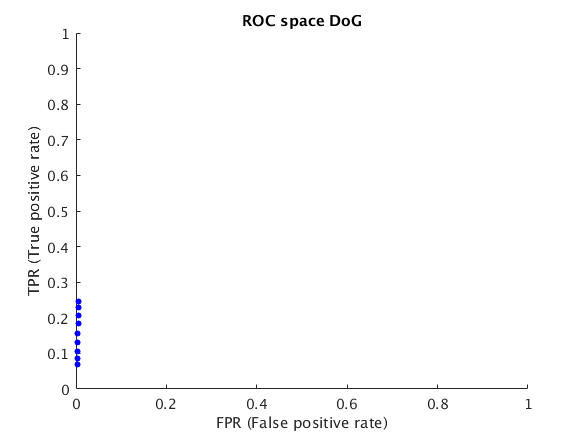
Difference of Gaussian
ROC space
Here the specificity is very high compared to DoG applied on 9343 AM. This is again the consequence of not having the intra-cell holes that would count as edges.
Sensitivity/Specificity against minimum sigma