9343 AM
Background analysis
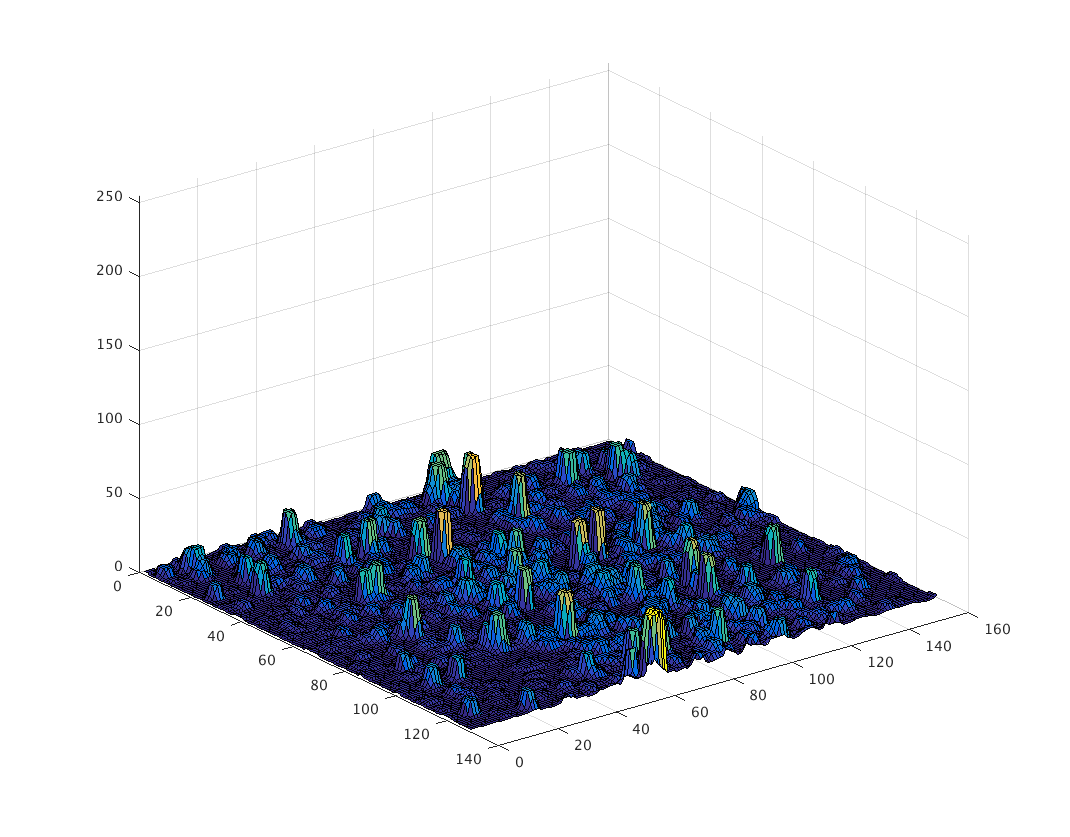
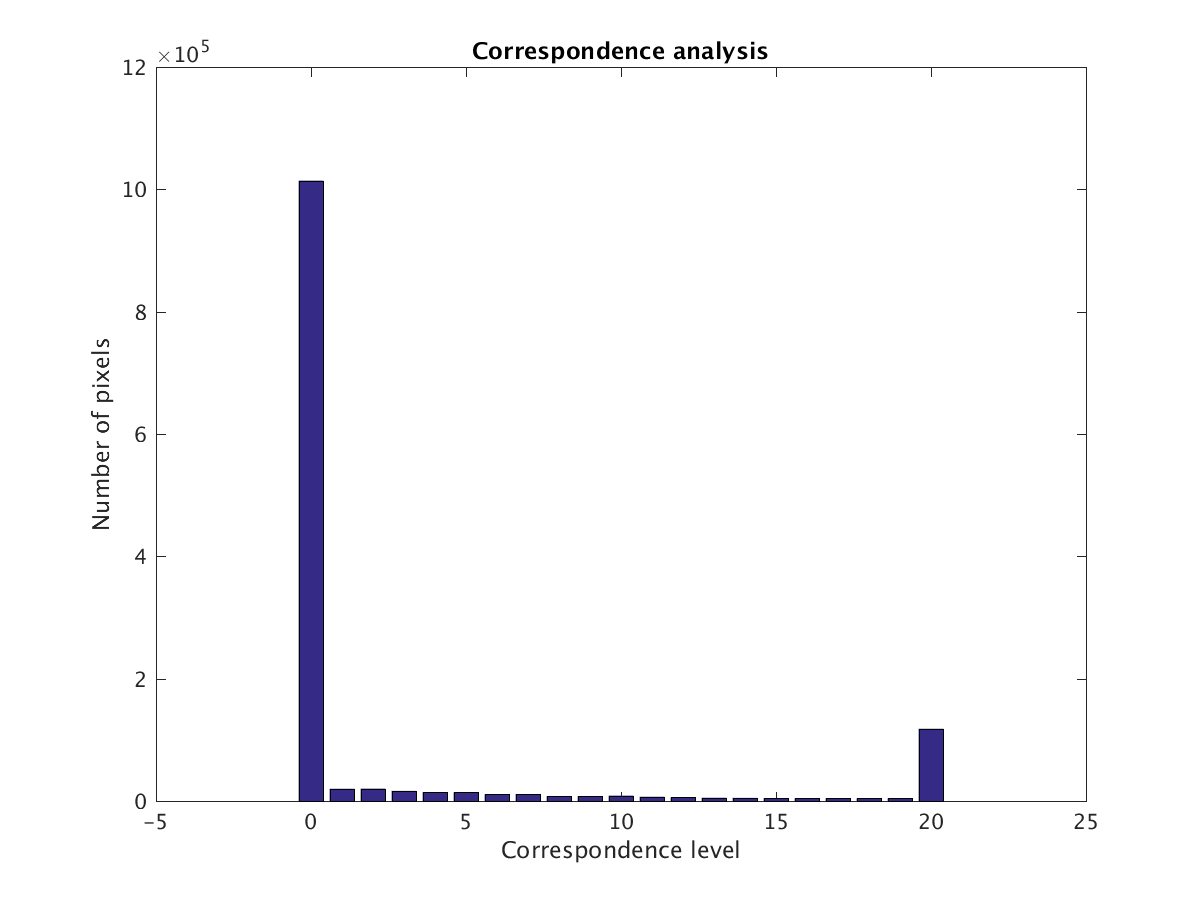
We can see that the borders of the image are very dark. The high peaks indicate the cells and the lower ones are the fluorescence around them. From this analysis we can conclude that this is the so-called "speckled" pattern of antinuclear antibody test.
Otsu
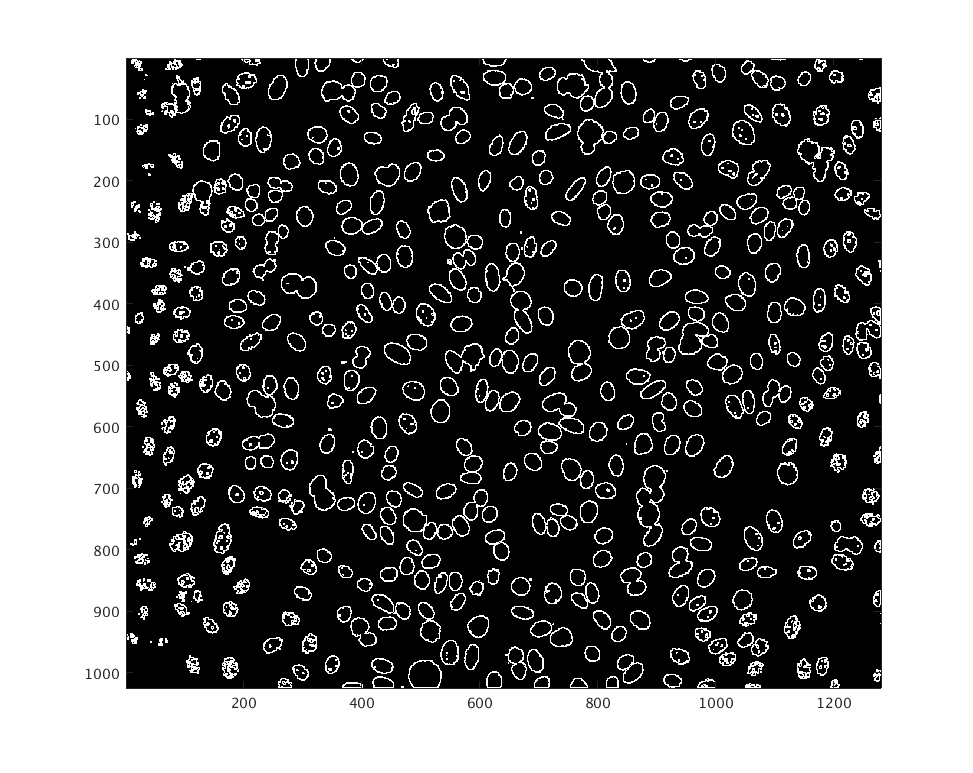
Results (optimal threshold = 0.0902)
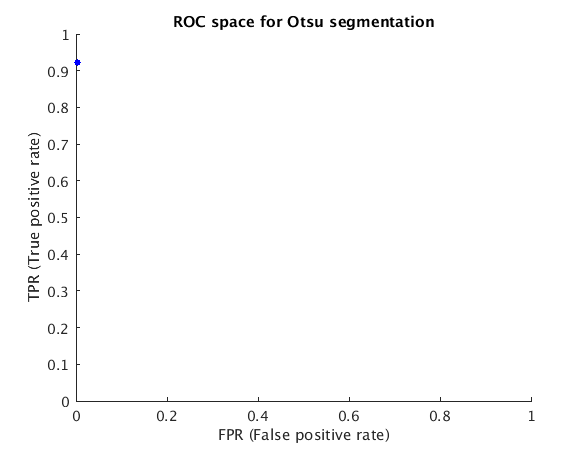
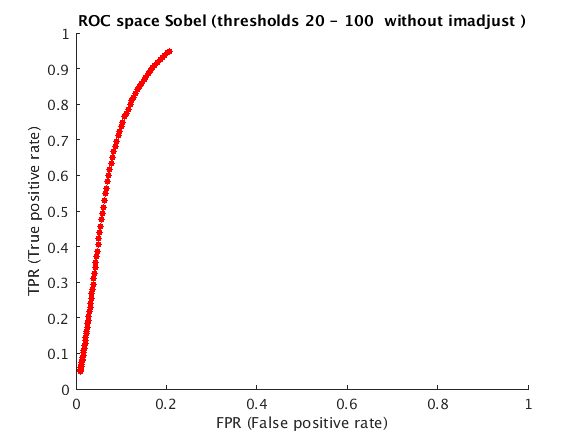
ROC space
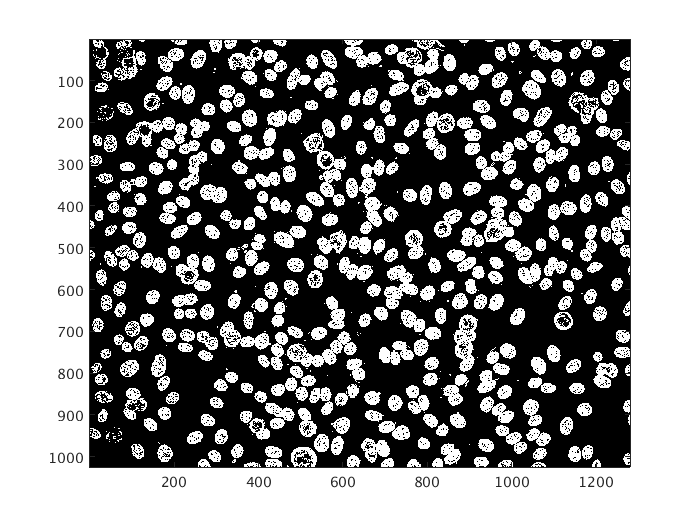
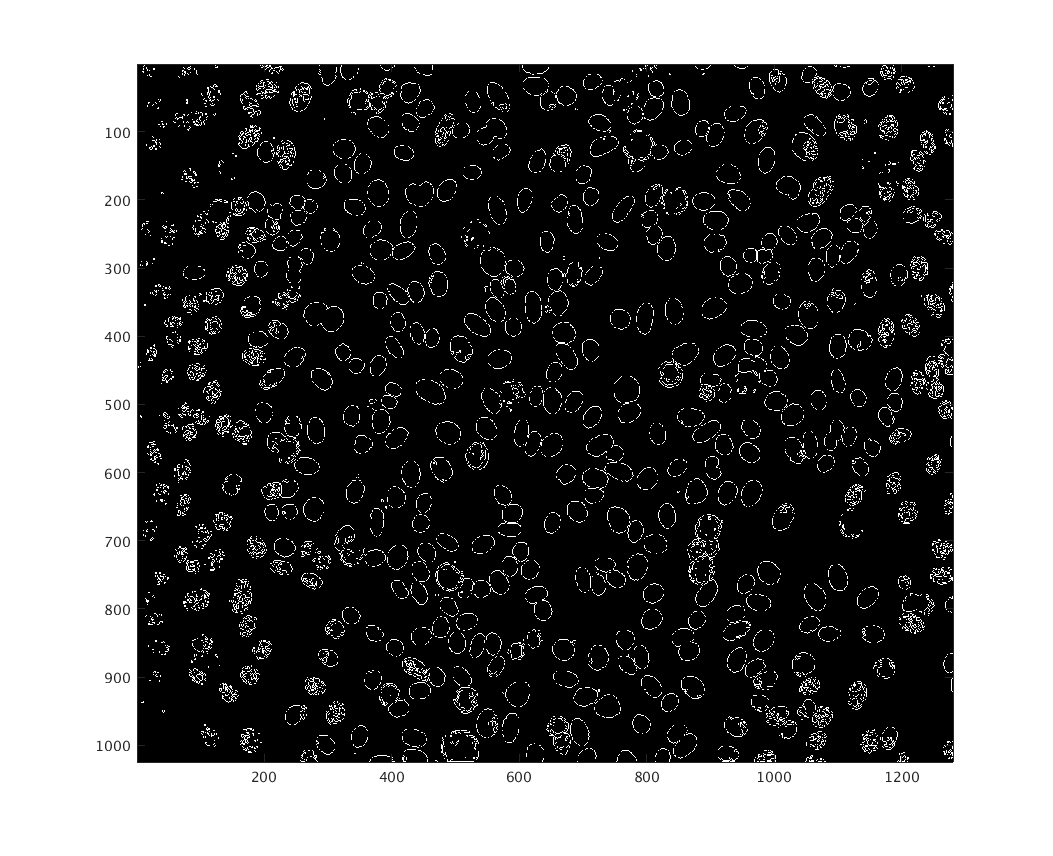
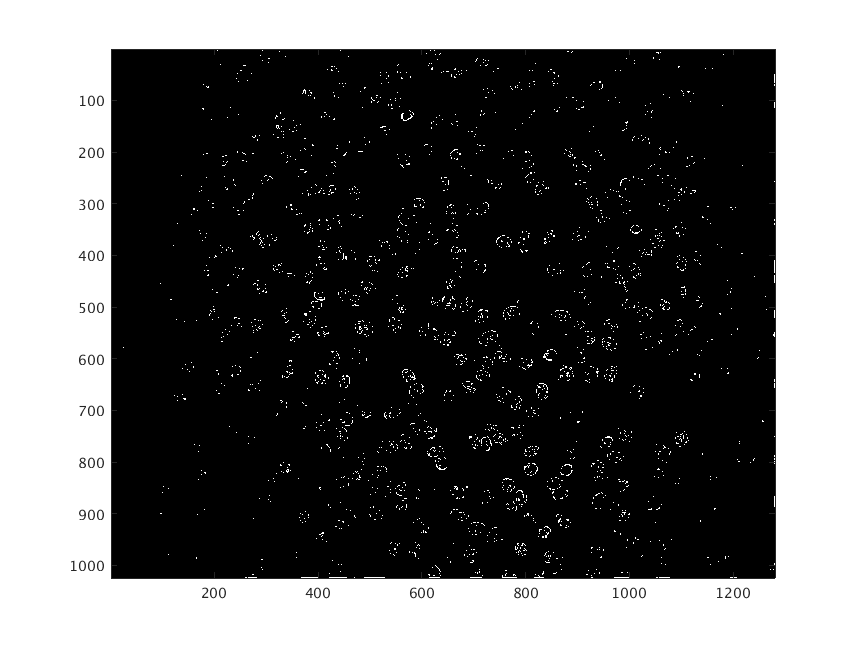
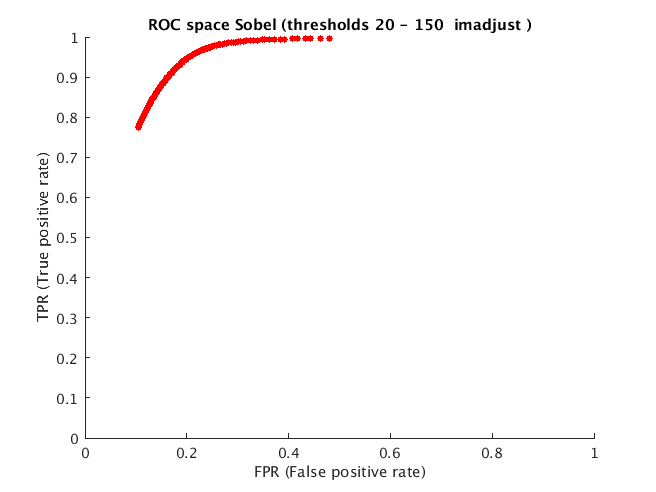
Sobel
Results (low, optimal and high threshold)
ROC space
From the ROC space we can see that high threshold values give very low sensitivity but high specificity. This is because most noise edges are removed (non-edge finding likelihood increases) but we have remove a lot of true edges (true edge finding likelihood decreases).
The optimal threshold is the point which lies on the diagnosis line chosen to be from (0, 1) to (1, 0).
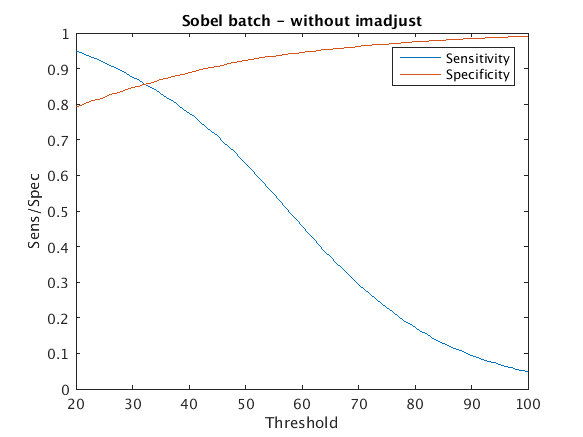
Sensitivity/Specificity against threshold
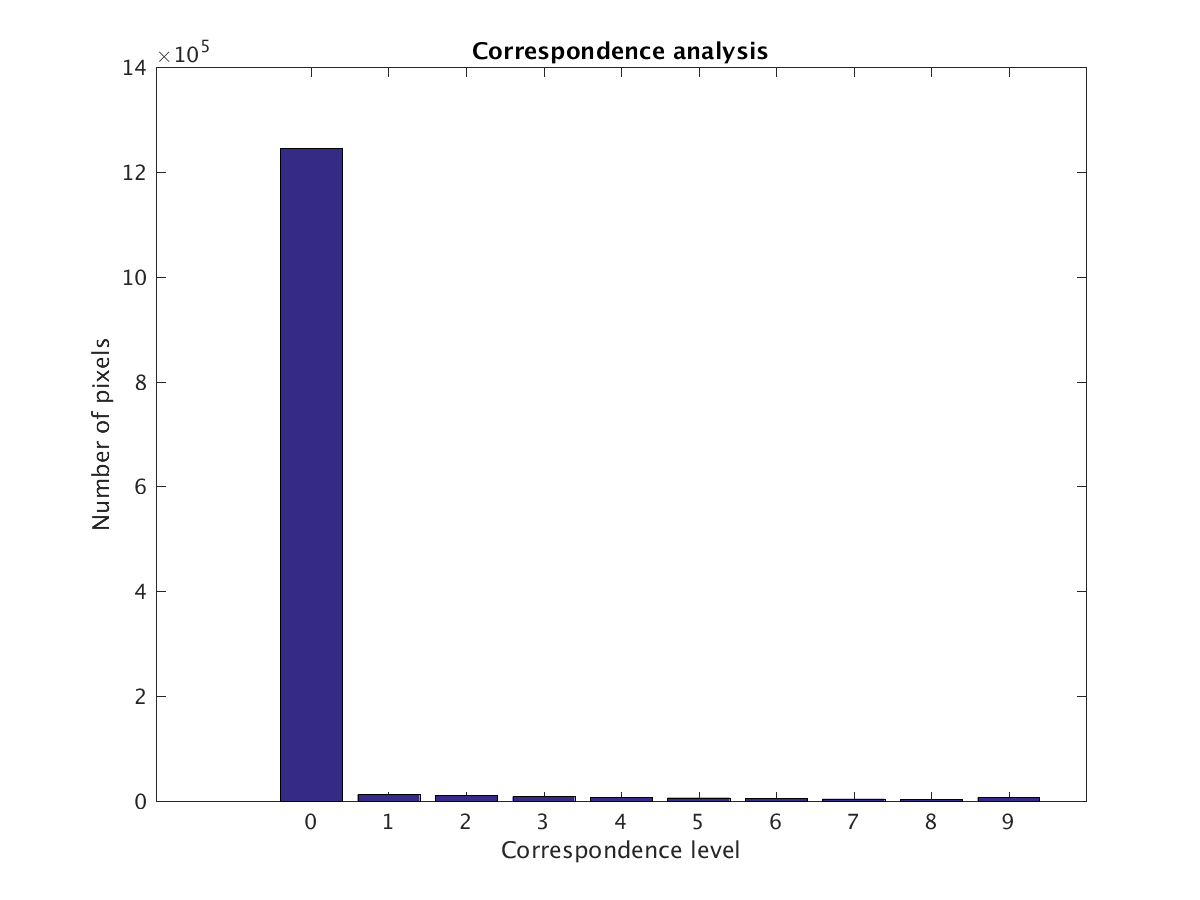
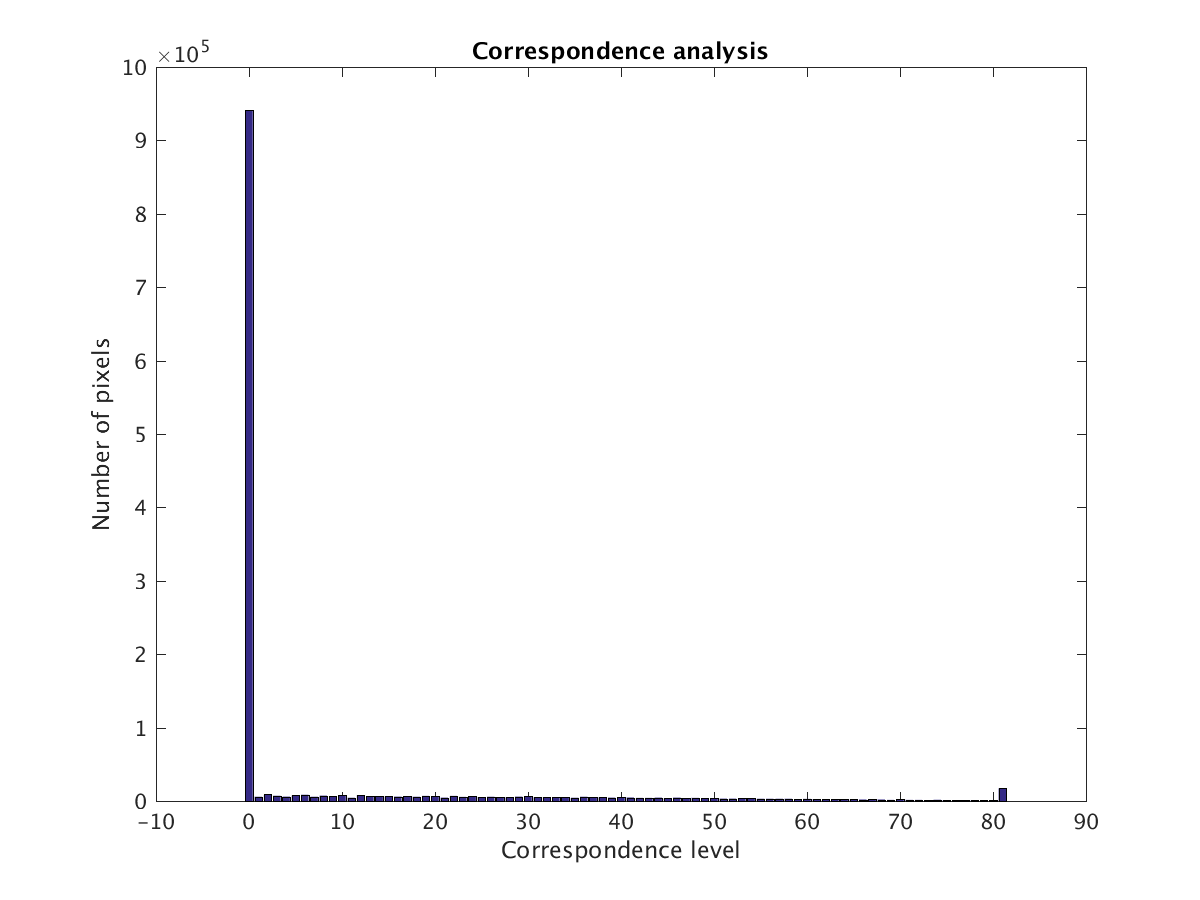
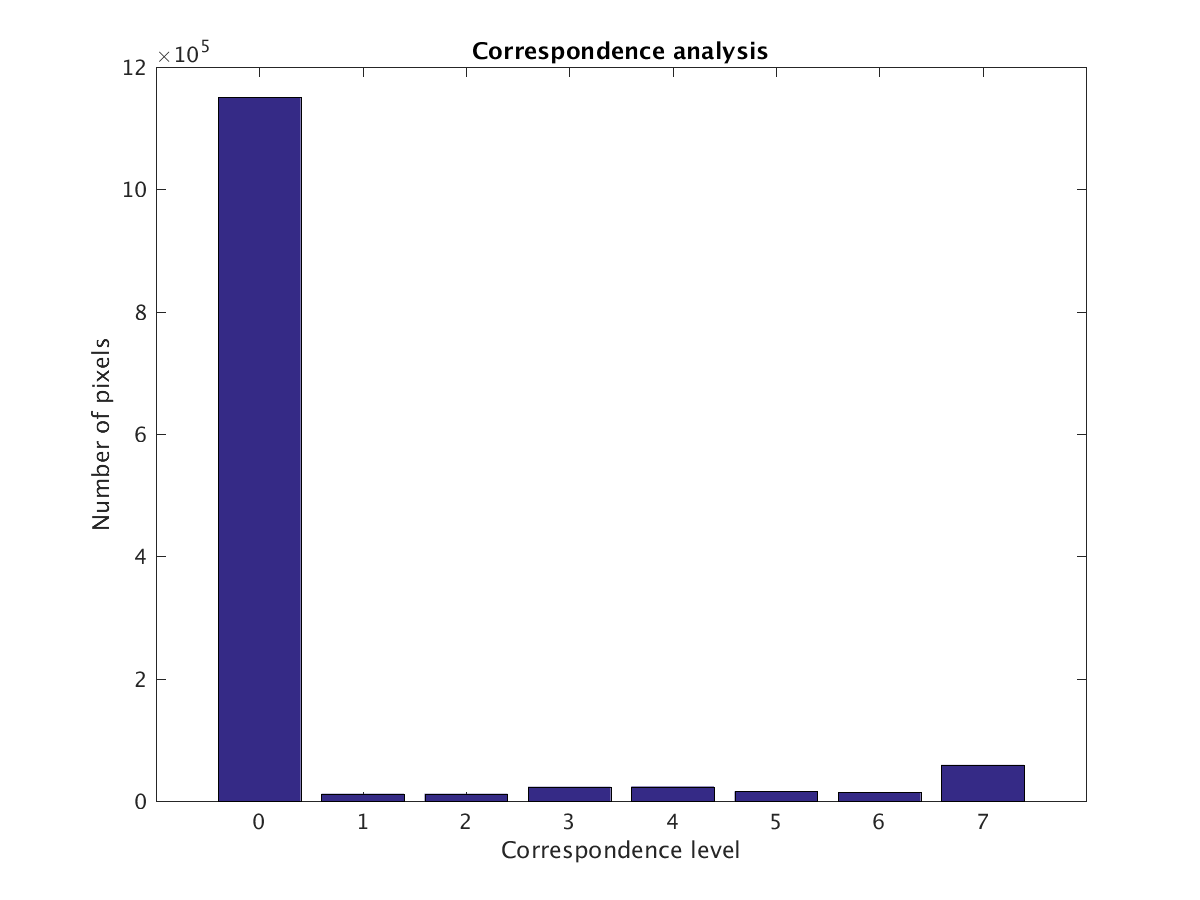
Correspondence analysis
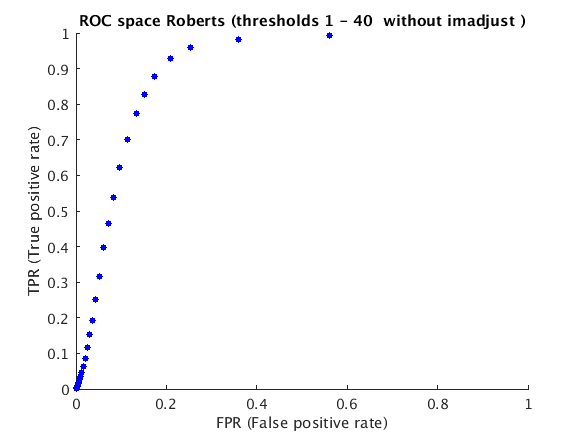
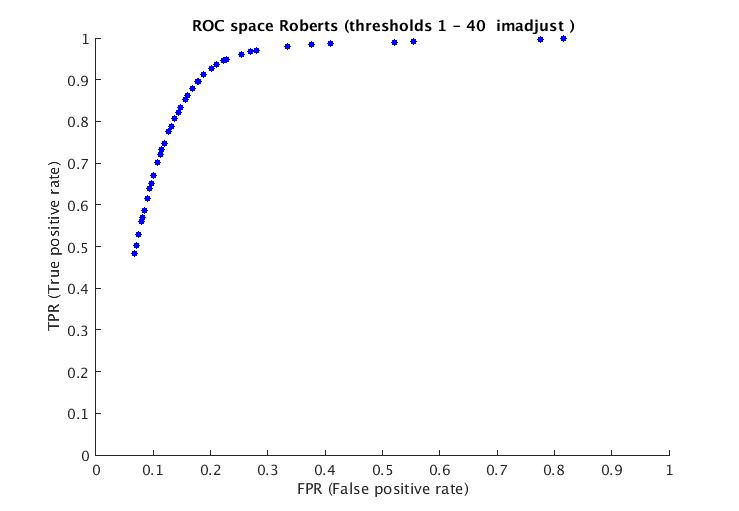
Roberts
ROC space
Sensitivity/Specificity against threshold
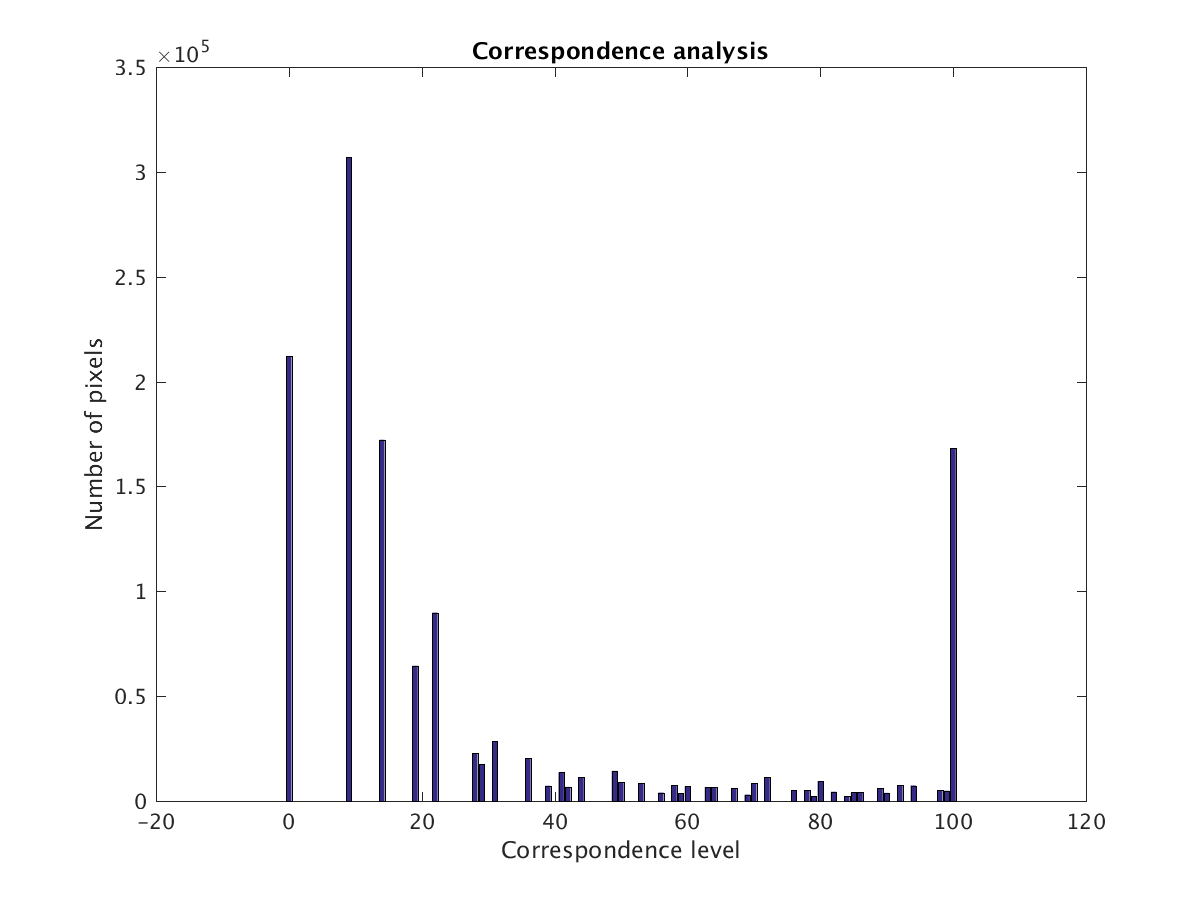
Correspondence analysis
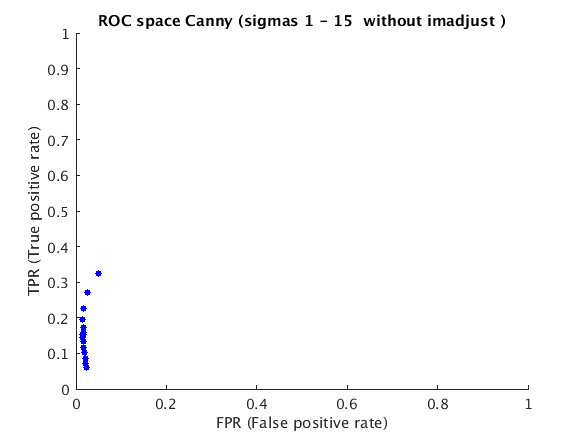
Canny
ROC space
See report for information on why Canny performed "badly". Even between sigma (0, 1] the sensitivity is under 0.40
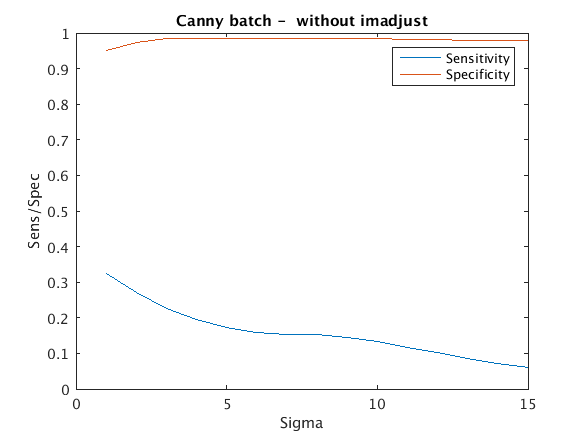
Sensitivity/Specificity against sigma
Correspondence analysis
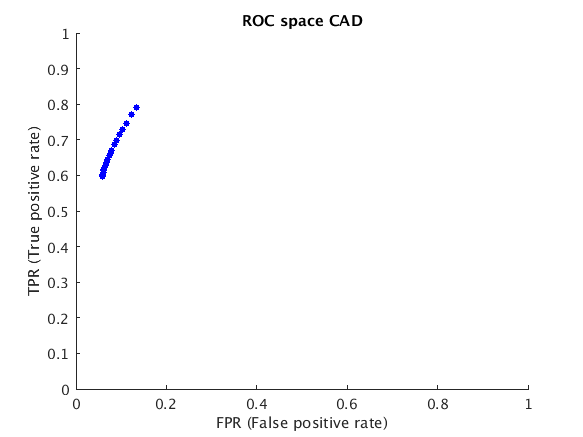
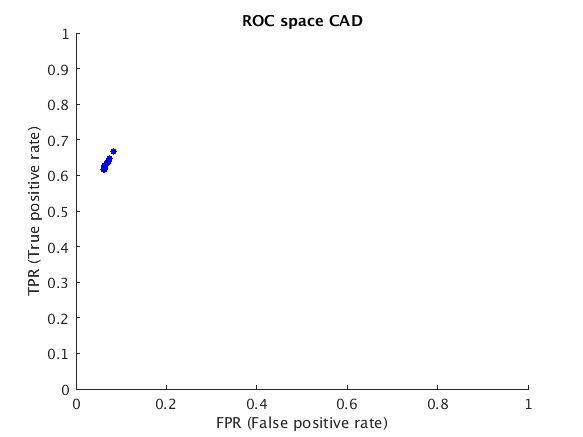
Canny with Anisotropic Diffusion
For explanations please see the attached report.
Results (1, 5 and 15 iterations)
ROC space
As we can see Anisotropic Diffusion has improved Canny a lot (doubling the sensitivity value). This is because AD removes noise without blurring the image (instead it sort of "cartoonizes" it). This enables canny edge detector to not suffer from low intensity cells at the edges (and therefore miss edges and creating discontinuities).
In fact Anisotropic Diffusion is widely used before segmenting cell images.
Sensitivity/Specificity against number of iterations and kappa
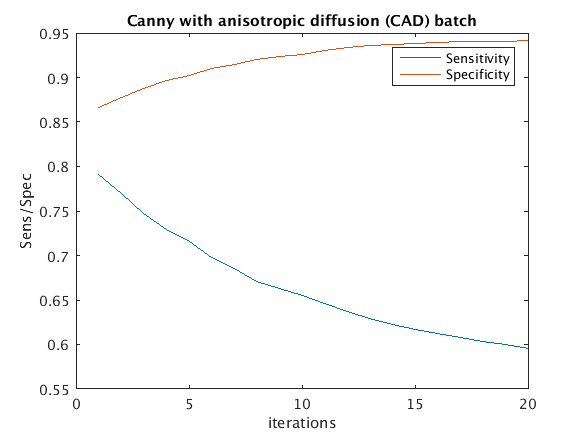
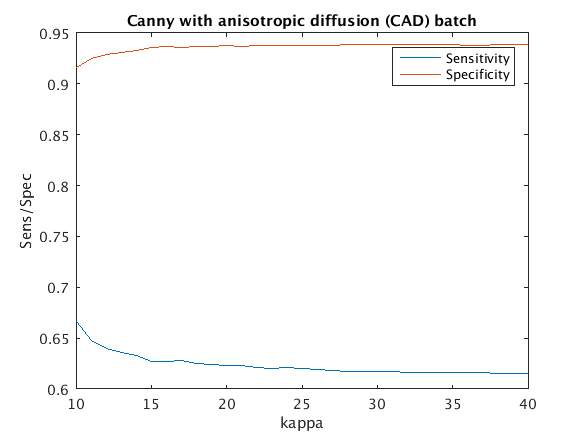
Correspondence analysis
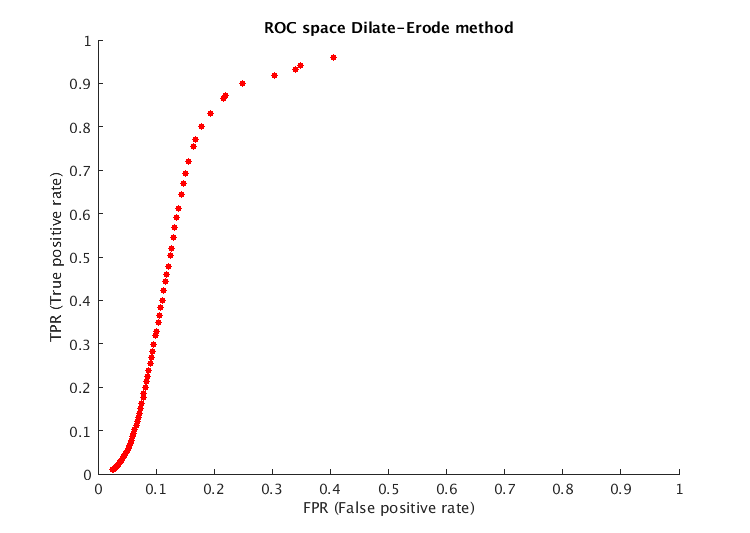
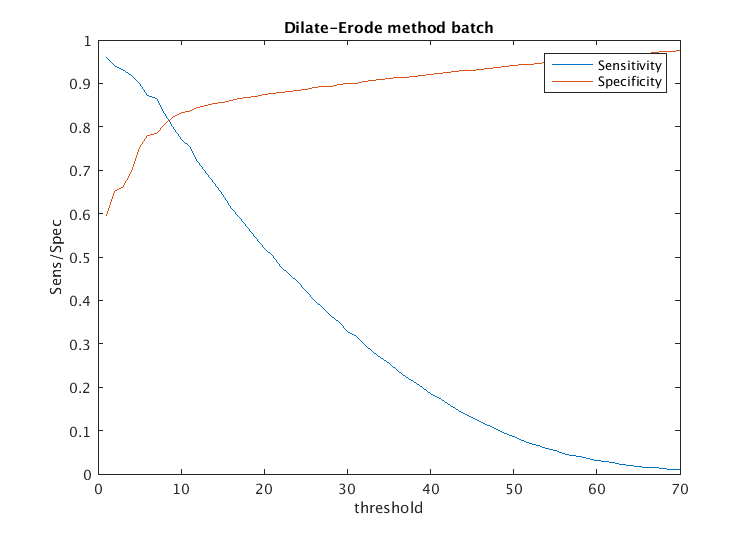
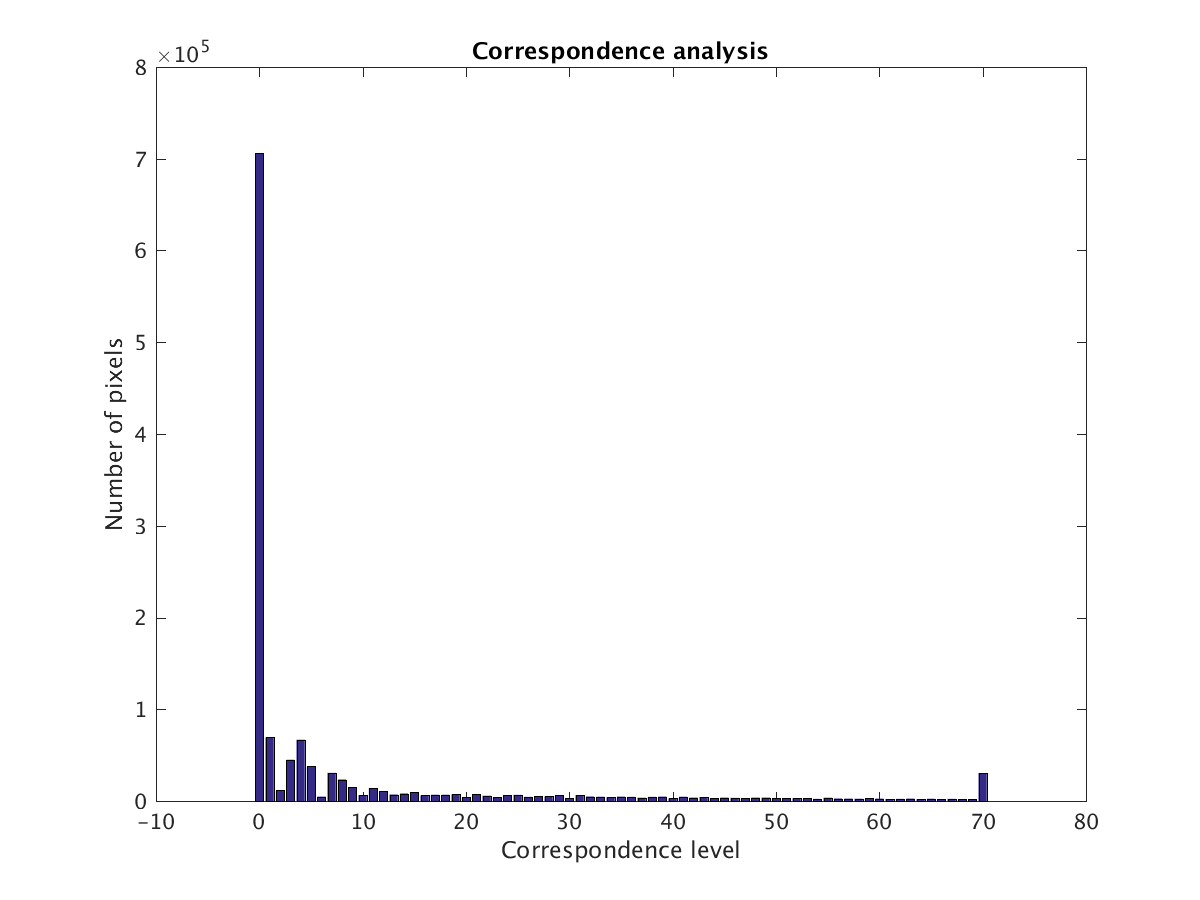
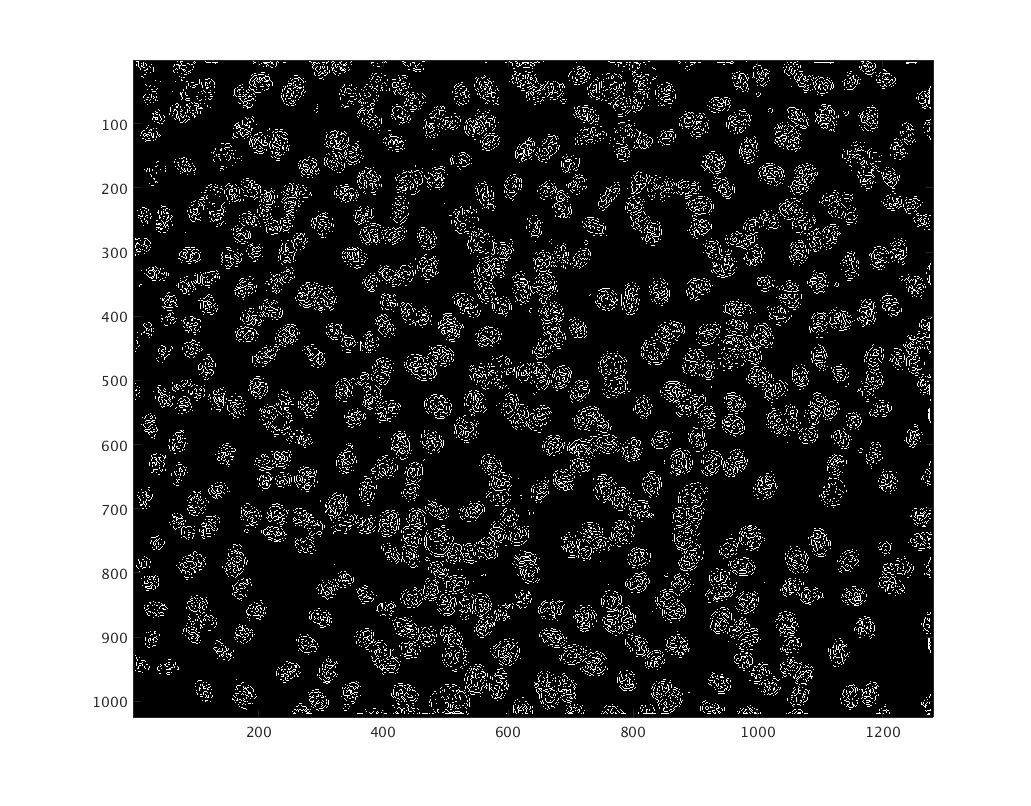
Dilate-Erode method
For explanations please see the attached report.
Results (threshold at 10, 30 and 50)
ROC space
Sensitivity/Specificity against threshold
Here we can notice that the sensitivity decreases very fast compared to Sobel (or Roberts). This is because during the erode process some edges might be removed and this propagates to the Sobel edge detection and thresholding.
Correspondence analysis
Laplacian of Gaussian
For explanations please see the attached report.
Results (sigma: 1 and 3)
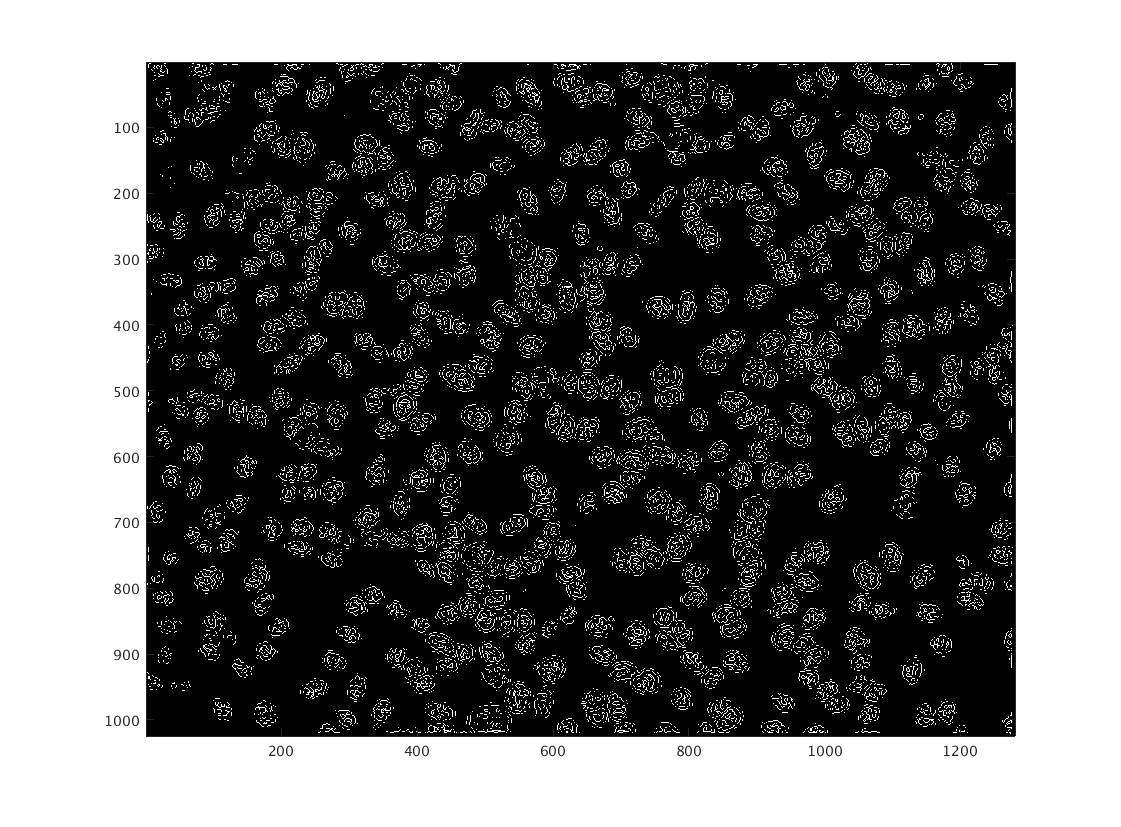
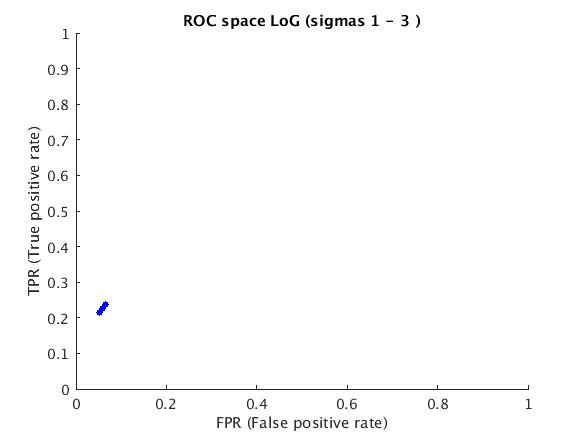
ROC space
It can be noticed that LoG did not perform very well with this image. One can note that specificity if high because most of the non-edges are correctly detected. However we have the same problem with Canny (without AD) where edges around the cell are detected. As we saw this can be solved using the dilate-erode method.
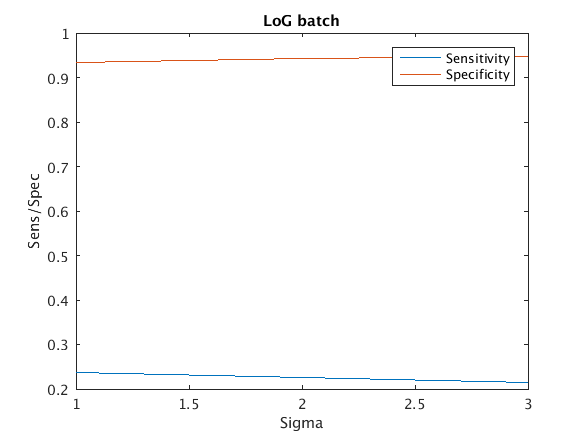
Sensitivity/Specificity against sigma
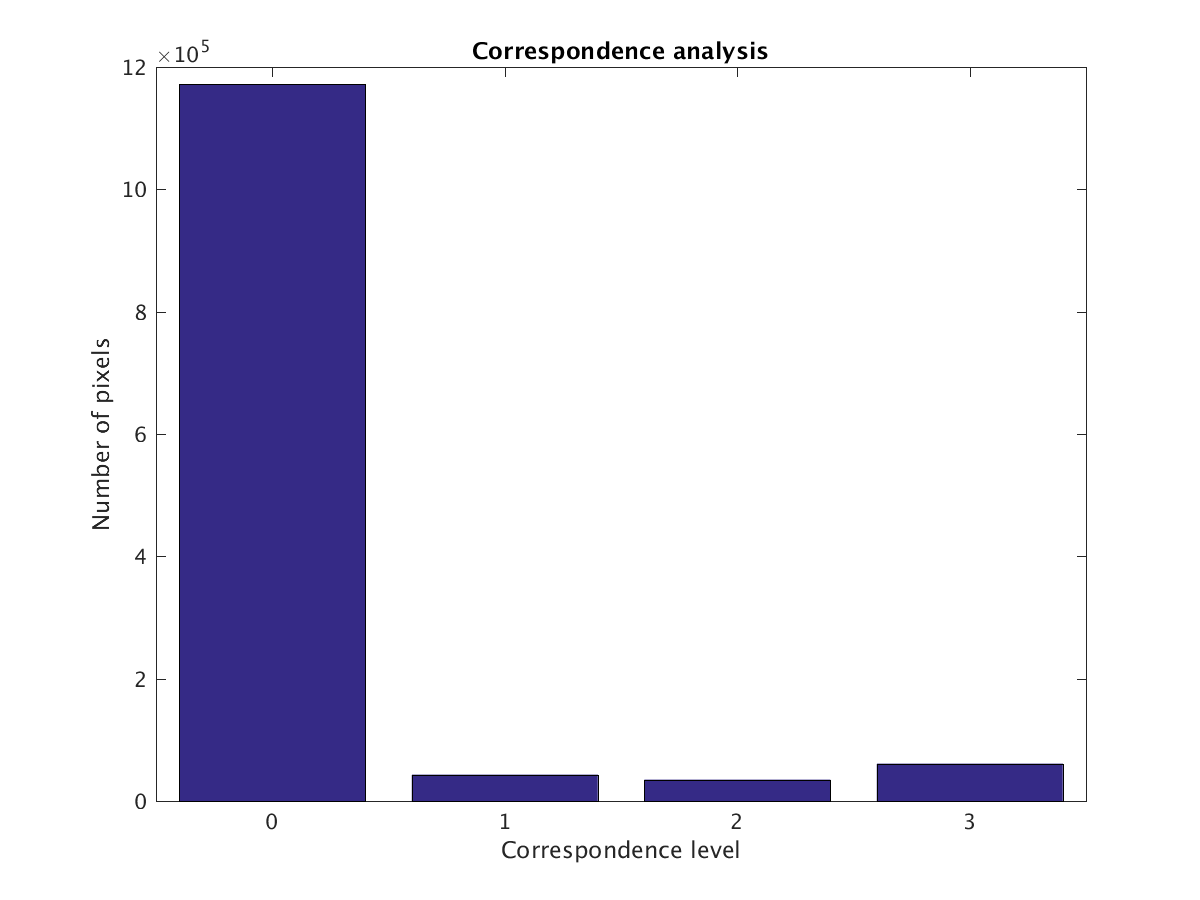
Correspondence analysis
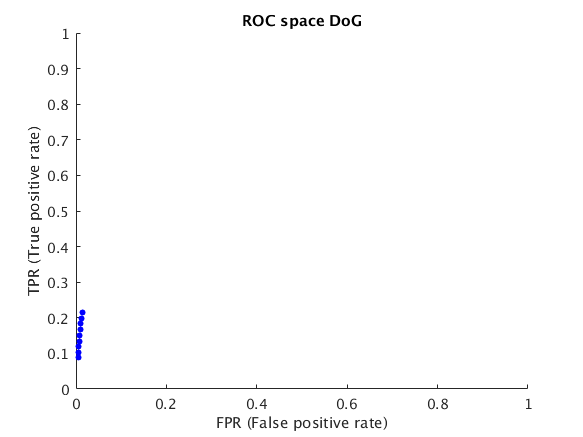
Difference of Gaussian
ROC space
One can see that DoG is an approximation of LoG since the two have almost similar ROC space points (according to their respective parameters).
Sensitivity/Specificity against minimum sigma

Correspondence analysis